In the first chapter In our "How To" blog series, we have already shown how you can train an AI using data with the help of the Smart Predict function. We demonstrated this using data from a fictitious store.
Once we have built our prediction model, it is useful to first look at the training results to identify the drivers and trends that lead to these results. SAP Analytics Cloud Smart Predict provides us with comprehensive tools to explore all the necessary details of the underlying model. These tools are tailored for the respective model types (classification, regression and time series) and therefore differ slightly between different scenarios. In this part of the paper we will only discuss the analysis of a regression model.
Root Mean Square Error for quality measurement
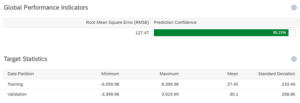
The quality of a regression model can be measured by the so-called root mean square error (RMSE). This indicator, which shows the root mean square deviation, is a statistical tool. It is used to assess the quality of a prediction. The RMSE thus provides information about the robustness of the model. It ensures that similar statements can be made with high confidence for new data sets.
Analyzing the model with SAC Smart Predict
SAC Smart Predict divides our training dataset into two parts. One part is used to train the regression model. The other part is used to validate the trained model. In this example, the Root Mean Square Error is calculated from these two data sets. We then see additional information in the Target Statistics, such as the mean and standard deviation for each part of the training dataset.
In our case, we achieved a confidence level of 95.21% with this model, which is just above the recommended confidence level of 95%. Ideally, one would aim for a confidence level above 99%. Our error is 127.47. This means that the actual value has a difference of +/- 127.47 from our estimate. Ideally, this value should be smaller than the standard deviation and therefore better than a very naive model with a mean +/- standard deviation.
Influencer Contributions
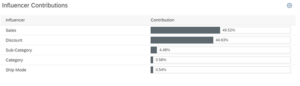
Influencer Contributions are quite self-explanatory in themselves. However, for the sake of completeness, we would like to discuss them in more detail. Influencers are variables that have an impact on the target. By default, all columns and dimensions are considered influencers. After training, these are reduced to the most necessary columns and dimensions. In our case, we can see that sales and discounts have the biggest impact on profit. In the Influencer Contributions view, there is a more detailed view of the so-called influencers.
Estimated and Actual Graph
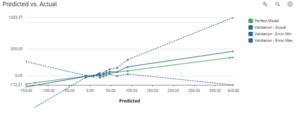
The Predicted vs. Actual Graph allows us to see at a glance the accuracy of our model. The graph consists of three different curves.
- Green - Perfect Model: The curve represents a hypothetical perfect model.
- Blue - Validation Actual: This curve shows the actual target value as a function of the forecast.
- Blue Discrete - Validation Error Min/Max: These two curves represent the minimum and maximum expected deviation of the validation data set. The interval between the two curves is the confidence interval.
How can these graphs be interpreted?
Ideally, we have a model where the green and blue curves are close to each other and have a similar shape. In this case, we can be confident that our model can make intelligent predictions about unknown values. If this is not the case, then the quality and robustness of our model is not very good.
The model should then be trained with larger or new data sets. New influencers should also be taken into account. If the curves are mostly the same and only differ in certain segments, this indicates that the model itself is good, but improvements are still possible.
For segments with large deviations, it is likely that there is not enough training data. Here too, the training dataset should probably be expanded or new influencers added. In our case, we are happy with our model for now. In the next installment of our How-To blog series, we apply our forecasting model to a new data set to make profit forecasts.