First and second In part one of our blog series on Smart Predict, we trained a regression model in SAP Analytics Cloud and analyzed the results of the training. In this part, we now apply the trained AI to a new data set to obtain predictions.
Applying the model to a new data set
If the results of the forecasting model are satisfactory and we are confident that the regression model can produce accurate predictions, we can apply it to new data sets.
Step 1: Creating a new dataset
To do this, we first create a new dataset with the values to be estimated. For instructions on how to create datasets, see our first post (see Using Smart Predict to Train an Artificial Intelligence).
Step 2: Apply the Predictive Model
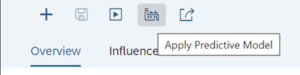
Now we open our regression model again and select "Apply Predictive Model" in the top toolbar.
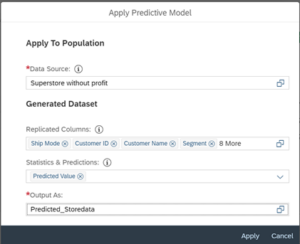
We then fill in the next window as follows:
- Data Source: This refers to the data set to be estimated.
- Replicated Columns: This contains all columns that will be displayed in the predicted data set. If this field is left blank, the result will show only one column - the predicted values.
- Statistics and Predictions: This refers to results that can be calculated from the trained model. These include the following:
- Application Date: Date of application of the record to the model.
- Training Date: This refers to the date when the training of the model took place.
- Assigned Box: This is a kind of "virtual container" to which the record is assigned, or in simple terms a category/classification to which the object is assigned (this is particularly relevant for classification models).
- Outlier Indicator: The indicator shows whether the data set is an outlier.
- Projected Value: This is the projected value.
- Estimate Explanations: The factors that led to a particular forecast are shown here.
- Output Format: This is the name and path to the new output file.
Step 3: Replicate the data set
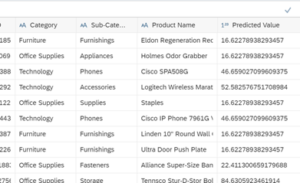
In our example, we now duplicate all columns of the dataset and select Predicted Value in the "Statistics and Predictions" section.
Step 4: Receiving the new data set
We then confirm the entry by clicking on "Apply". Our regression model is now applied to the new data. We can follow the progress of the application in the drop-down menu below (Predictive Models). When the status shows "Applied" (green), we can import our new data set with the prediction data in the desired path.
Modeling the new data set
The dimensions and key figures of our new dataset can now be modeled in SAC Modeler. This is especially necessary for the integration of the dataset into stories or dashboards. Furthermore, it is possible to enrich already existing stories with additional diagrams. By adding to existing diagrams, newly gained knowledge or insights are also depicted in an easily understandable way. This makes it easier for decision makers to make more informed business decisions.
Conclusion: AI implementation is not witchcraft
In this blog series in the first chapter We gave an overview of different forecasting scenarios and showed how we can train a regression model.
And then in the second part He learned to interpret the training results using statistical methods and identify drivers. Finally, in the last section, we applied our trained regression model to a completely new dataset to obtain a prediction of future revenues.
The aim of the blog series was to show that the application of AI technologies is not witchcraft and how easy it is to make and interpret predictions with SAP Analytics Cloud.